
Simulate data for optimizing scales of effect with unmarked
Source: R/sim_dat_unmarked.R
sim_dat_unmarked.RdGenerates simulated replicated detection/non-detection or count
data formatted for use with the unmarked package, with known
kernel-weighted landscape covariates at a controlled scale of effect.
Arguments
- alpha
Numeric scalar. Intercept for the abundance/occupancy linear predictor. Default:
1.- beta
Numeric vector of slope coefficients, one per raster layer in
raster_stack. Length must equalnlyr(raster_stack).- kernel
Character. Kernel function used to weight raster values by distance. One of
"gaussian"(default),"exp"(negative exponential),"expow"(exponential power), or"fixed"(fixed-radius buffer).- type
Character. Response type to simulate. One of:
"count"(Default) Poisson-distributed abundance with binomial thinning to simulate detection probability
det."count_nb"Negative binomial abundance with dispersion
StDev, then binomial thinning."occ"Bernoulli occupancy data; occupancy is generated from a logistic model and detections follow
Bernoulli(occ * det).
- StDev
Positive numeric. Dispersion (size) parameter for
"count_nb". Default:0.5.- n_points
Positive integer. Number of spatial sample sites. Points are placed on a hexagonal grid and randomly subsampled. Default:
50.- n_surv
Positive integer. Number of repeated surveys per site, forming the columns of the returned observation matrix. Default:
3.- det
Numeric between 0 and 1. Per-survey detection probability applied via binomial thinning of the true abundance/occupancy. Default:
0.5.- min_D
Positive numeric. Minimum inter-point spacing on the hexagonal grid. If
NULL(default), set automatically to1.55 * max(sigma).- raster_stack
A
SpatRasterobject. Layer names become covariate names in the returned data frame.- sigma
Positive numeric vector. True kernel scale parameters, one per raster layer. Must be in the same units as the raster projection.
- shape
Positive numeric vector. Shape parameters for
kernel = "expow", one per raster layer. Required when using the exponential power kernel.- max_D
Positive numeric. Maximum buffer radius for
kernel_prepduring simulation. IfNULL(default), set automatically to 110% of the one-dimensional distance enclosing 99% of kernel weight along a line atmax(sigma). Supply a largermax_Dif the radius enclosing 99% of weight on a plane is needed.- user_seed
Optional integer seed for reproducibility. Default:
NULL.- ...
Additional arguments. Not currently used.
Value
A named list with three elements:
yInteger matrix of dimensions
n_points x n_survcontaining the simulated replicated observations. Pass as theyargument when constructing anunmarkedFrame.dfData frame with
n_pointsrows. Theycolumn contains the simulated true abundance/occupancy (before detection thinning). Remaining columns are the true kernel-weighted covariate values, scaled to zero mean and unit variance.ptsAn
sfPOINT object withn_pointsrows. Anobscolumn is appended containing the true abundance/occupancy values. Pass tokernel_prepaspts.
Details
Sites are distributed on a hexagonal grid across the interior of the raster
extent (85% of the x/y range) and then randomly subsampled. The true
abundance or occupancy at each site is a function of the kernel-weighted
landscape covariates at the specified scale. Repeated surveys introduce
imperfect detection controlled by det.
Use the returned y matrix and df (as siteCovs) to
construct an unmarkedFrame, fit a model, and then pass both the
fitted model and fresh kernel_prep output to
multiScale_optim.
Examples
# \donttest{
rs <- sim_rast(dim = 50, user_seed = 123)
rs <- terra::subset(rs, c(1, 3))
s_dat <- sim_dat_unmarked(alpha = 1,
beta = c(0.75, -0.75),
kernel = 'gaussian',
sigma = c(40, 80),
n_points = 20,
n_surv = 3,
det = 0.5,
type = 'count',
raster_stack = rs,
max_D = 220,
user_seed = 123)
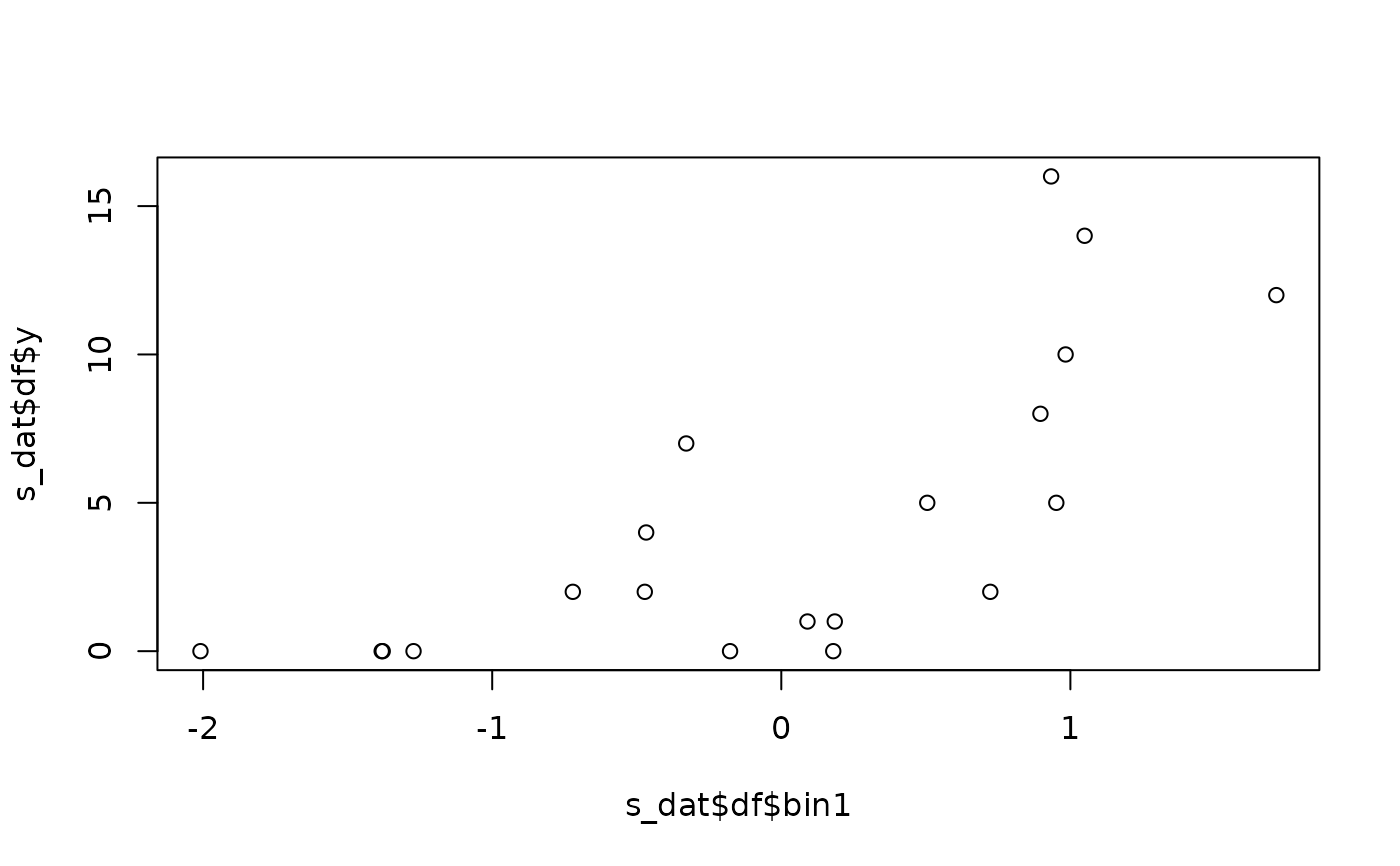
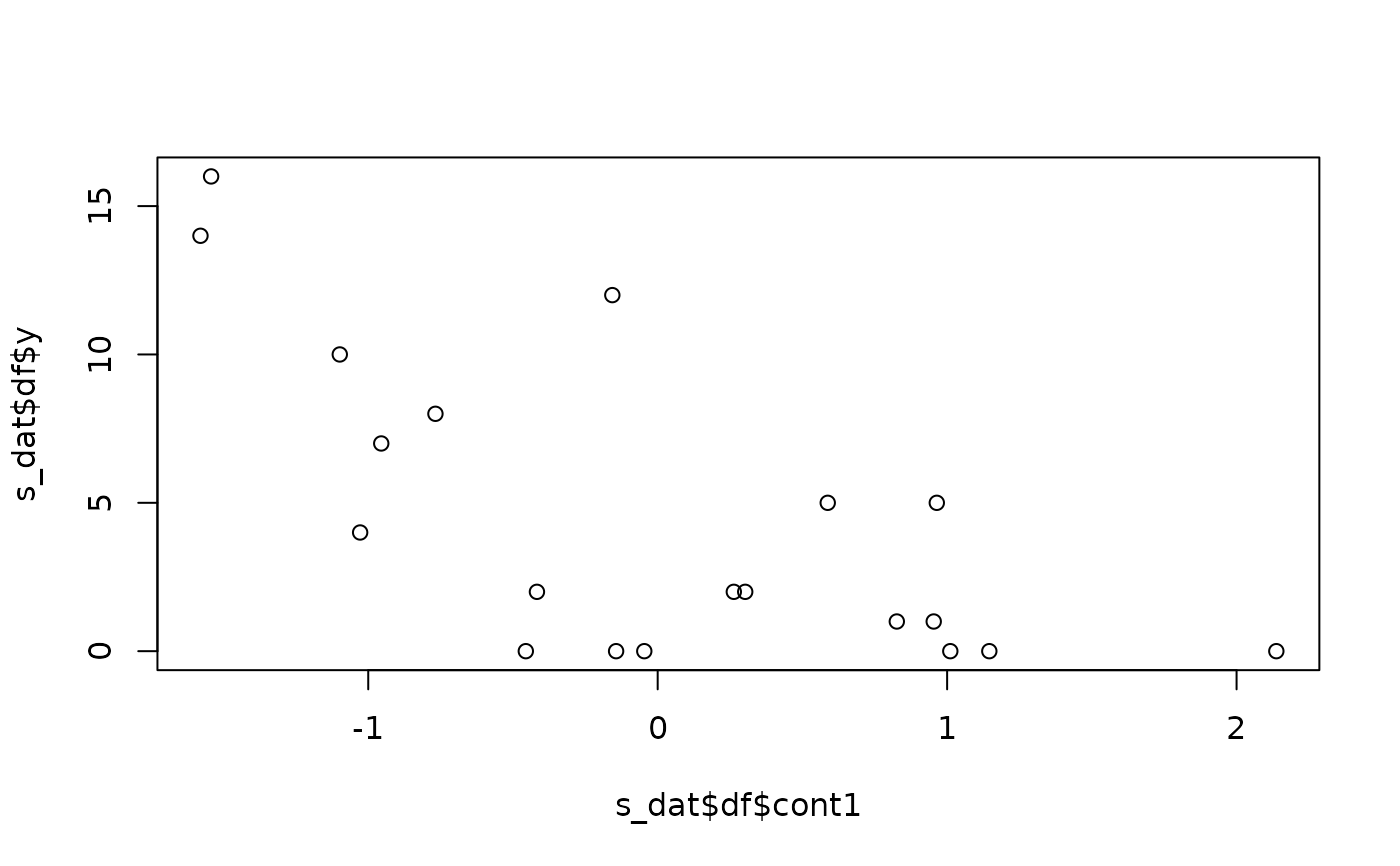
# True abundance rises with bin1 (beta = 0.75) and falls with cont1 (-0.75)
plot(s_dat$df$y ~ s_dat$df$bin1)
 plot(s_dat$df$y ~ s_dat$df$cont1)
 # Observed counts: one row per site, one column per repeated survey
head(s_dat$y)
#> [,1] [,2] [,3]
#> [1,] 1 1 0
#> [2,] 0 2 1
#> [3,] 0 0 0
#> [4,] 0 0 0
#> [5,] 3 3 2
#> [6,] 2 3 5
## unmarked analysis
kernel_inputs <- kernel_prep(pts = s_dat$pts,
raster_stack = rs,
max_D = 220,
kernel = 'gaus',
verbose = FALSE)
umf <- unmarked::unmarkedFramePCount(y = s_dat$y,
siteCovs = kernel_inputs$kernel_dat)
## Base unmarked model
mod0 <- unmarked::pcount(~1 ~ bin1 + cont1,
data = umf,
K = 30)
## The unmarked optimization is slower than the simulation and base model
## fit, so it is skipped in automated example checks.
if (interactive()) {
opt1 <- multiScale_optim(fitted_mod = mod0,
kernel_inputs = kernel_inputs)
summary(opt1)
}
# }