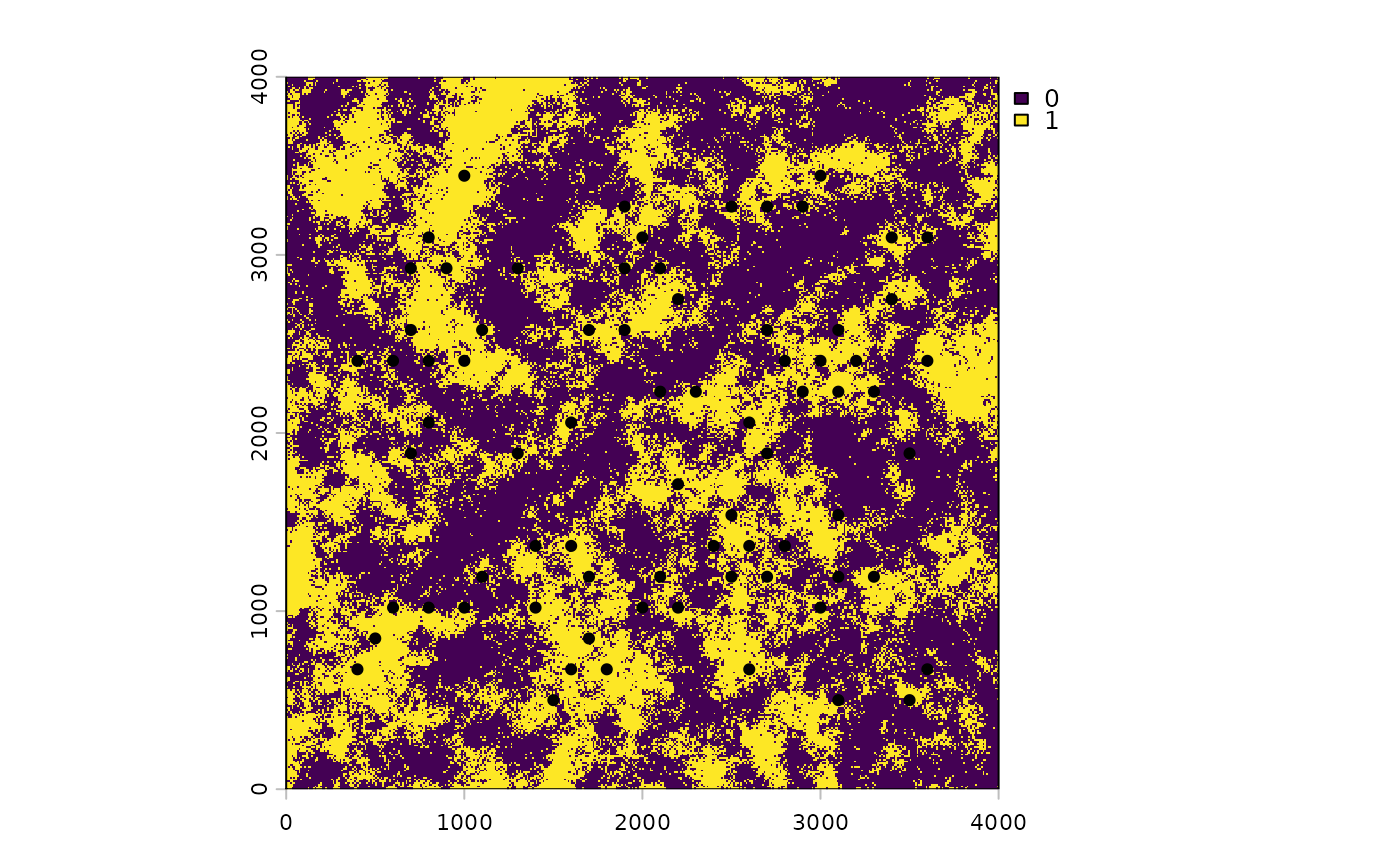
Locations of the 75 survey points that go with count_data and the
hab.tif raster.
Usage
data(pts)Format
An sf point object with 75 features, no coordinate reference
system, and coordinates in the map units of hab.tif (from 400 to 3600).
Its one attribute column, obs, repeats the counts in count_data$y.
Examples
data(pts)
pts
#> Simple feature collection with 75 features and 1 field
#> Geometry type: POINT
#> Dimension:     XY
#> Bounding box:  xmin: 400 ymin: 500 xmax: 3600 ymax: 3444.486
#> CRS:           NA
#> First 10 features:
#>                        x obs
#> 1   POINT (3100 1539.23)   1
#> 2  POINT (1600 673.2051)   6
#> 3  POINT (2900 2232.051)   0
#> 4  POINT (2700 2578.461)   0
#> 5  POINT (1900 3271.281)   0
#> 6  POINT (3600 2405.256)   4
#> 7  POINT (1700 2578.461)   2
#> 8  POINT (2500 3271.281)   0
#> 9   POINT (400 2405.256)   0
#> 10  POINT (2100 1192.82)   1
hab <- terra::rast(system.file("extdata", "hab.tif",
                               package = "multiScaleR"))
terra::plot(hab)
terra::points(terra::vect(pts), pch = 19)